During the pandemic, ThinkGlobal Qualitative and its partners conducted a two-week-long multi-country online study among younger respondents around the world in order to identify the core emotions and potential trends that have emerged among consumers.
The study was conducted in Mexico, USA, France, Germany and South Africa. These are highlights of our findings in Mexico among Millennials from medium and high socio-economic levels.
Millennials are a market segment with ever changing preferences. One day they are totally into doing something or consuming a brand, and then they just as quickly move on to something else without looking back. It is a smart and socially involved market segment and Coronavirus has certainly changed many of their views and perspectives towards consumption, society and life.
Many started lockdown with panic purchases or increases in online shopping. Spare time and fear resulted in an online shopping spree, as against the current more controlled shopping where they are re-thinking what they really need.
- “I had too much stuff/ I was consuming too much”
Millennials are now re-orienting their priorities in a range of areas from food delivered to their homes to furniture and beyond.
- “I purchased an office chair for my home”
- “I purchased plants because they make me happy and I created a small corner for myself to relax at home”
- “I adopted a dog from the shelter.”
RECONFIGURATION OF DESIRES AND NEEDS
Millennials are re-evaluating many of their preferences, goals and desires. The history of desire will be rewritten. Desires will be framed by a paradigm shift on the question: What is really valuable in life? And what can brands do to support these new desires?
Family is one of the elements that Millennials value most.
For many who still live with their Parents, close coexistence has strengthened ties and made them give a higher meaning to the concept of family
- “What I value most is the quality time I can spend with my family, my boyfriend, my friends and my pet. Today I know that those “little things” that I share with the people I love are what make me the happiest.”
- “I feel like all of this has given me a chance to re-examine what is truly meaningful, like spending time with someone I love, caring for my plants and my Pets, enjoying new types of exercise and my body, and all those small things that show me what life is actually all about”
For Millennials who live by themselves, lockdown has demanded a big sacrifice, who miss hanging out with nuclear family and friends. They have realized the value of face to face interaction, and although they have kept in touch through social media or digital platforms, they feel it is not the same as personal interaction
- “I have always had this love/hate relationship with social media and online platforms….but now it is the only way I stay in touch with my loved ones”
ETHICAL LIVING
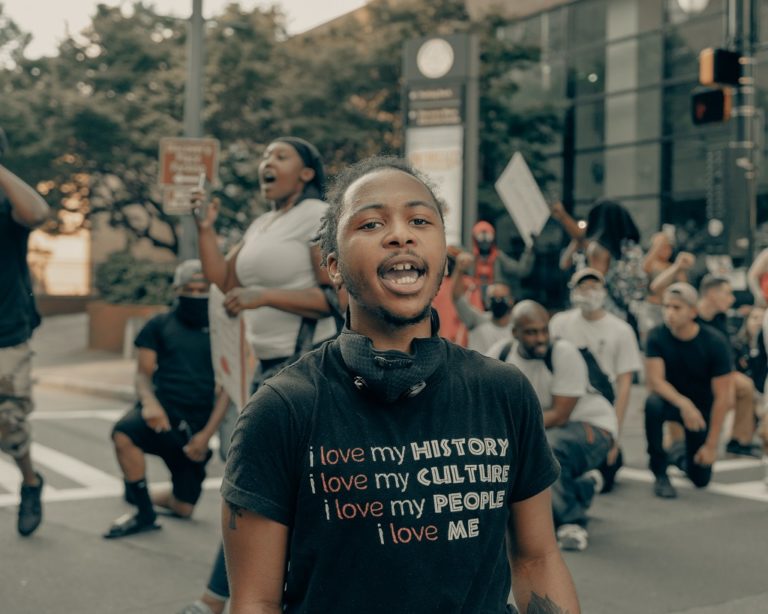
Social inequities: Young people are especially sensitive to the injustices and social inequities derived from ideas that seek to prioritize economic position or models of supremacy.
Discrimination in any form worries them and they would like a more equitable and just society, that provides the same opportunities for development regardless of skin color, religion or social economic level
- “I’m feeling overwhelmed with sadness and frustration, my heart is heavy for the black community.”
- “I’m extremely disappointed with the way the American Government is handling the protests, and the rhetoric they are creating around them”
- “I am now worried about taking care of myself while taking care of others and the planet”
Expressions of superiority: Mexican Millennials reject expressions of superiority because they can lead to the oppression of others. They are willing to protest in favor of social justice.
- “My main news source these days is Twitter and it is great in some ways, but terrible in others. It inspires me, but there is a lot of unprocessed anger there, as well as moral superiority, which is dreadful.”
- “People who suffer oppression will likely continue to depend on risky work to survive within this system.
Anti-capitalist feelings: Mexican Millennials believe that capitalism has led to prioritizing material goods over people, so they want to change that attitude that has led to inequality and injustice.
- “Shopping used to be my way to deal with anxiety, but this offers a false promise of fulfillment. Now I’m trying not to fall prey to that idea. I am more aware of sustainability and social justice.”
Ecology: This generation is concerned about the environment and the consequences of pollution; they are in favor of things like shared rides, as well as technology that may help the environment.
- “I expect there to be a massive increase in the use of bikes as a mode of transportation. I also expect ride sharing to continue but probably on a lesser scale, since the risk of infection is higher. And of course, cars will definitely still be around, but hopefully the future of the industry becomes centered around zero emission cars.”
- “Caring about our environment and taking action to change what we can, defend our beliefs”.
MENTAL HEALTH
In addition to the trends related to physical health, for some time now, mental health has been a meta-category that will need to be addressed by products and brands. What are products doing – whatever the market segment – to take care of people’s mental health on a daily basis?
Millennial Mexican consumers have become more selective in their attitudes towards life, preferring small things that give them true pleasure and discarding what hurts them or is ephemeral.
- “I like consuming media that is soothing, enriching and insightful”
Millennials report increased purchases of products to pamper themselves and to help them reduce stress and cope with the lockdown situation in a more rewarding way.
- “I’ve increased my purchases of things that make my home feel special, I’m using up more scented candles, I got a ton of new crystals, and I’ve been really thinking about getting more plants – I think there’s been a focus in getting things that feel like a treat for me.”
And regarding health in general, for many Millennials, the fear of getting infected, or infecting someone they love, will remain present until a vaccine or cure is found.
- “I am eating more frequently at the market, and I bring my own silverware, because I think that at this moment it is very important to support local businesses and families.”
- “At some point, we will have to leave our homes to face the new normal, and I know that a very high percentage of the population is likely to get infected”
Happiness: For Millennials, happiness means seeking satisfaction in what they do and in their relationship with society. The pandemic has been a time of self-discovery and has made them reflect on whether they are really happy and what they need to achieve happiness.
- “I want to learn new things every day. I imagine myself in 2025 as someone who is looking not only to have professional and economic success, but also as someone who is looking to be happy and to be able to share that with the people I love.”
- “I have stopped spending money in things that make others perceive a certain image of me. Now, I spend money only in what I think will make me happy”
- “In the long term I feel like I’ve been forced to look at my life choices and the way my career has evolved, and really question if this is the path that I want to keep going on. It’s been a few months of a lot of self- discovery”
SOLIDARITY
The loss of freedom and collective uncertainty due to the lockdown has awakened feelings of human kindness and the desire to overcome this situation together as a society.
Belonging to a community and being able to contribute is relevant for young people, who believe that the world is interrelated and that we must think collectively in order to generate benefits for more people.
Millennials consider that previous generations had an individualistic, selfish approach and did not consider the future of humanity as a whole.
- “I would love to get involved in something like a local garden, or community farm. Something that makes me feel connected to my community”
- “I think tourism will be more conscious, maybe something that will include helping communities… I think vacation-volunteering-programs will become more popular. People are engaging more with communities so I think this type of tourism will increase its popularity.”
Millennials are taking things into their own hands, they are taking responsibility to improve their surroundings, society, even the economy. There seems to be a new ‘ethic of solidarity’ – Millennials realize that their economy depends on others, which is something they must change immediately. Young consumers have an important code of solidarity that encompasses multiple areas and is manifested in many ways.
- “If others do not win, I do not win, if others do well, I will do well too”.
- “Fashion can change the way you feel and you can help others with fashion and beauty.”
- “Having empathy for others leads to common well-being; if everyone is taken into account, we can create a better society.”
- “No more selfish capitalism, everyone must show the solidarity and value the ecosystem to which they belong.”
Responsible consumption: Since many decided to stay at home, they are not spending money on restaurants, clubs, gas, tolls, etc. Instead they are spending on improving their homes, entertainment and new hobbies.
Some are able to save money since their regular expenses have gone down, while others have increased their online shopping.
- “I’m trying to: save more, be more selective with where I spend my money, get into the habit of donating to causes I consider worthy, and also enjoy what I have while I have it (I realize now more than ever that life is short and finances uncertain).
- “For a while now, I have been trying to buy only what I need (to buy less) and to be more aware of where and why I buy it.”
Responsible purchasing, fair-trade, ethical brands, animal welfare, ethics and fair-trade are important for young people as a way to favor their purchases towards those brands and products that take into account these conditions.
- “I think more and more I would like to eat at places that are being ethical in their treatment of employees and that also source their products locally.”
- “I subscribed to a service that delivers a box of fruits and veggies that are grown by local farmers from Xochimilco” (rural part of Mexico City)
Consuming local and organic: There is a huge trend towards organic / natural products, which gives them a sense of being closer to nature and favoring a healthier diet
- “I want a small place with a nice backyard or patio where I can plant some vegetables”
With the pandemic, some young people have been more motivated to decrease their meat consumption, not only because of their personal health, but because of concern about the environment and global health
- “I’ve been reading a lot about the benefits of reducing my meat consumption and/or becoming a vegetarian, not only because it will have an impact on my health and the environment, but it can also help to prevent a future pandemic (epidemics are generally caused by the consumption of animals).”
There is also less consumption of processed products. Being able to cook and eat at home has led to increased importance of home-cooked food and a decline in consumption of processed food
- “I will continue cooking and eating at home, I’ll stop buying ready-to-eat food and I will try to eat even healthier.”
- “In the future I’d really like to still eat homemade food, this is now very important to me”
In Mexico, Millennials from medium and higher socio-economic levels seem to believe that people and corporations (brands) working together could help achieve real improvement (many are distrustful or disappointed in the government); people tend to prefer brands that share the value of supporting each other to come out of the crisis as fast as possible.
MOBILITY AND SOCIAL SPACES
People who can stay at home and decide to gradually get out of the quarantine are privileged. Those in lower socio-economic levels do not have that luxury, and in order to earn some income, they are being forced to use public transportation, go to work, etc.
The most valuable brands will be those that occupy an urban or exterior space and do something relevant with it.
Millennials are talking about emotional, physical and even spiritual freedom.
Outdoor spaces have gained even more relevance, but dramatic changes will need to occur to allow Millennials to feel safe and protected, while also supporting a really strong set of values related to equality, environmental protection, etc.
Nevertheless, interactions with strangers, outside the protection of their homes, have become weird and paranoid because their health is at stake.
- “I leave home to shop for groceries or something like that, but one can feel the fear in people, they have this need to avoid any type of contact with anyone, they even avoid to have eye contact with others and I think that’s very sad”
INCREASED VALUE OF HOME & HEDONISM
During lockdown, most gained an increased appreciation of their home and re-discovered different places at home. Many mentioned that home used to be where they just came back to sleep. Now home is the safe place, where they re-connect with nature.
- “I love sitting on my balcony, next to the plants and listening to birds”.
Their ideal home includes an outside place that connects to nature and includes plants. A place to have friends over. They also value large kitchens, because they re-discovered that cooking their own food implies being healthier, a moment of relaxation and also saves money.
Blurred work/play boundaries: We live lives in which the boundaries between pleasure, work and entertainment are no longer clear. Home spaces now have different uses: the dinner table is now the working space for several family members; the living room is where they exercise, the bedroom might now have an area with plants that is someone’s personal and private corner. This has created the need to rearrange the furniture, buy new furniture, plants, etc.
The architecture of homes will change dramatically in order to allow for spaces to have multiple purposes. Those who share a home with others will need their personal corner or space. They seek to connect with nature in a safe environment and this will gain even more relevance and open the door to a new set of home improvement products in many different areas.
DESIGNING THE FUTURE
Concern about politics and how they affect societies: Young people have a critical attitude towards the government and the actions politicians have taken, as well as the way they are managing the economic and health crisis. There is a great fear that Mexico’s poverty levels will grow even more, and that everyone will end up living like in Venezuela.
- “I hate Lopez Obrador (Mexico´s President), because I value working hard and being able to have a good life style. But this ‘a-hole’ President believes that giving money away to people that don’t work is correct and he has a very communist and austere way of seeing how everybody should live. He hates entrepreneurs and big companies, he wants people to be mediocre and ignorant.”
Racism and inequality: Many Mexican Millennials care about international politics and tend to show concern towards the statements and actions that U.S. President Trump has taken as they go against what they want, which is a more egalitarian world without distinction of race or social level. This is closely related to how Hispanics are treated in the USA.
- “Everyone is worth the same, the color of your skin doesn’t matter, or where you come from. Donald Trump seems to value classism, racism and fascism.
Self-centered optimism: Younger Mexican consumers hope to learn how to be at peace with uncertainty, they want to feel ok with changes and things that are not in their power to control, in order to focus their efforts on pursuing their dreams. They have high expectations about their future and having a successful career and personal life.
- “I see myself managing my own company.”
- “I am focused on being a better person and achieving my goals despite the negative actions taken by politicians.”
Coronavirus is transforming people’s lives. We have covered a decade of change in weeks; one prime example is the speed with which people adopted new technologies.
Sticking to these new behaviors will depend on the satisfaction that people get out of the new experiences. We should prepare for consumption declines and trading down. Brands will need to address their footprint offer, and creating shopping experiences for the new reality as they follow consumers on their new journeys.